 Politics
Kerala Assembly Election 2026: A Complete Research Analysis
God's Own Country at the Crossroads. Inside the battle that aims to either break the state's historical political loop—or reinforce it permanently.
25 min read
A complete, verified breakdown of Indian political party finances for FY 2024-25 — income, assets, donors and spending for all 6 national parties and 11 top regional parties, from ECI audit reports.
By: StoryRendered
Published: June 16, 2026
Every year, India's political parties file audited income-tax returns and annual audit reports with the Election Commission of India (ECI). Buried in those filings is a clear answer to a question that shapes Indian democracy: who controls the money? We pulled the numbers for all six national parties and the eleven richest regional parties, cross-checked them line by line, and laid them out in full.
Indian party returns balance income = expenditure by adding a surplus/deficit line on the income side. So the headline "ITR Total" can overstate real money raised. Wherever this happens we show both the filed ITR Total and the Actual Earned Income — the cash genuinely received. All figures are in Indian Rupees. 1 Crore (Cr) = 100 Lakh (L) = ₹10 million.
One party towers over every other. The BJP's total assets of ₹12,171 crore are nearly eight times those of the second-richest party — and that second place belongs not to the Congress, but to Telangana's BRS.
Total assets in ₹ Crore. DMK figure is FY 2023-24 (latest available).
Together, the six national parties form a story of extreme concentration. The BJP alone earned more than eight times the income of all five other national parties combined.
Cash genuinely received, in ₹ Crore (excludes surplus/deficit balancing lines).
The BJP is not merely the richest party in India — it is the richest by a margin that has no historical precedent. In FY 2024-25 it earned ₹6,769 crore, held ₹12,171 crore in assets, and ran a surplus of nearly ₹3,000 crore. Its current assets alone (₹9,996 Cr) form the largest cash pool in Indian politics, and it carries effectively zero debt (total borrowings: ₹0.15 Cr).
Perhaps the most striking single fact is the trajectory: BJP income has multiplied 153 times in 23 years.
Actual earned income in ₹ Crore (selected years).
Of its ₹6,769 Cr expenditure, ₹3,335 Cr (49%) went to election and general propaganda — itself larger than the total income of every other party in India.
The Congress remains the principal national opposition, but its finances tell a story of strain. It earned ₹918 crore yet spent ₹1,112 crore, plugging the ₹194 crore gap with a drawdown from its General Fund. Income fell 25% from the previous year, and election spending alone (₹896 Cr) consumed 80.6% of all expenditure. Notably, it raised ₹350 crore through coupon sales — a grassroots channel the BJP barely uses.
Actual earned income by source, in ₹ Crore.

Mayawati's BSP is one of the most unusual entries in the entire dataset: it holds ₹666 crore in assets, is completely debt-free — and has declared zero donors in every year on record. All of its income comes from membership fees and "other income" (interest and property receipts). Its employee costs are a remarkable ₹0.05 Cr, pointing to an extraordinarily lean organisation.
Earned income by source, in ₹ Crore. Declared donations: zero.
BSP is the only party in the 65-party dataset to report no donors at all, across every available year — a structural quirk that sets it apart from every rival.
The CPI(M) is the most diversely funded national party: membership levy, donations, publication sales and other income are all active streams. It also records the lowest average donation of any national party — just ₹22,885 — reflecting a genuine small-donor, cadre base. Its employee bill (₹51 Cr) is unusually high for its size, a signature of its full-time cadre structure.
Earned income by source, in ₹ Crore — four active streams.
A leadership note: General Secretary Sitaram Yechury passed away on September 12, 2024; M.A. Baby was elected General Secretary at the 24th Party Congress in Madurai on April 6, 2025, with Prakash Karat serving as interim coordinator in between.
AAP is the most genuinely donation-driven party in the dataset — 99.9% of its income comes from donations, with an average gift of just ₹14,921. Income grew 73% in FY25, but it holds the lowest total assets of any national party (₹11 Cr) and is completely debt-free. Its peak donor count came early: 8,623 donors in FY 2013-14, during the party's founding wave.
Total income in ₹ Crore — a volatile, election-cycle-driven base.
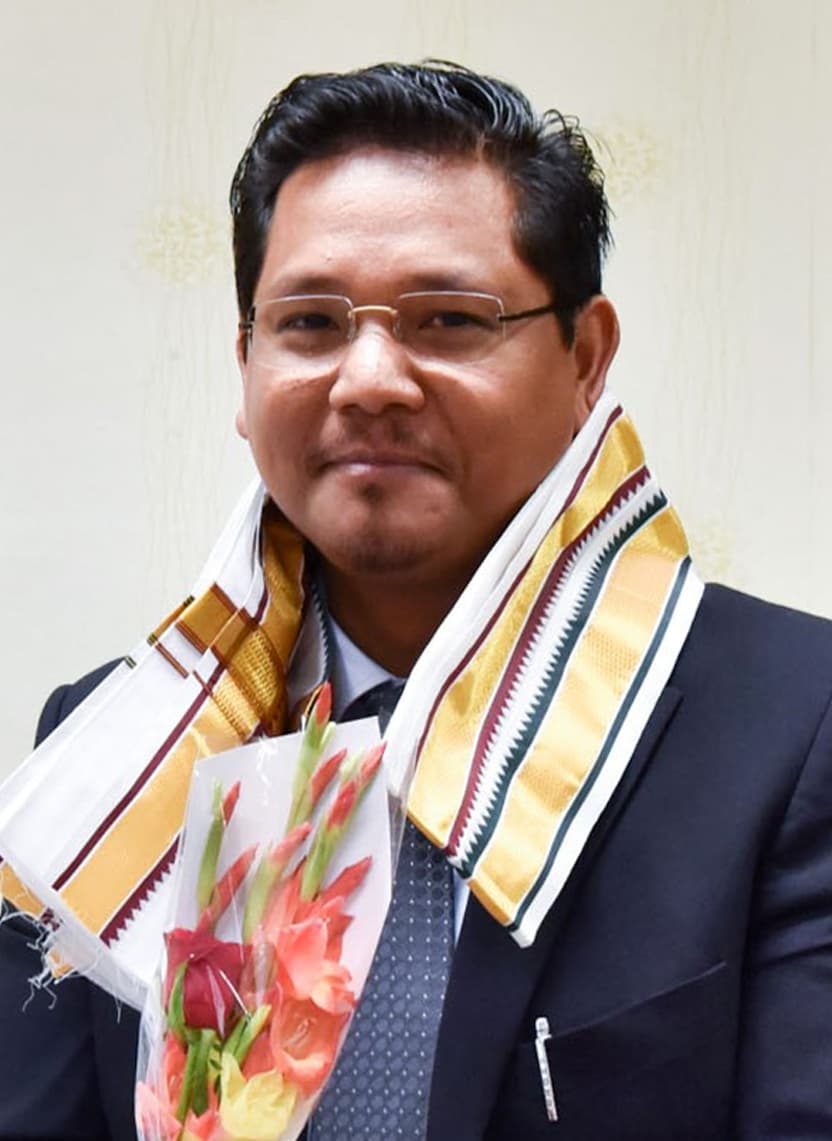
The smallest national party, NPP earned just ₹2.19 crore and holds ₹4.15 crore in assets. Active across the Northeast — Meghalaya, Manipur and Arunachal Pradesh — its income rises and falls sharply with the state-election calendar.
Total income in ₹ Crore. FY 2022-23 was a peak election year.
Regional parties hold a surprising amount of India's political wealth. Two of them — BRS and AITC — are richer than the Congress, and several run cash piles that dwarf their annual spending.
Total assets in ₹ Crore. DMK is FY 2023-24; others FY 2024-25.
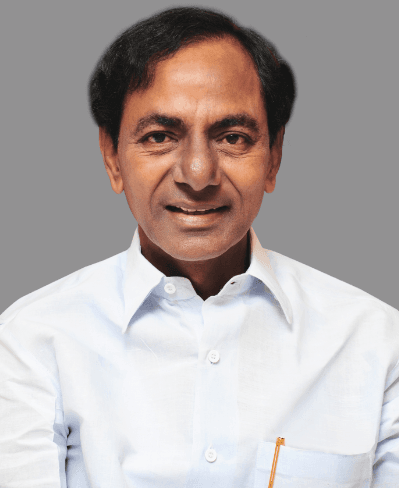
KCR's BRS is the second-richest party in India (₹1,561 Cr assets), holding a staggering ₹1,474 Cr in current assets. It also recorded the highest average donation in the entire 65-party dataset: ₹3.28 crore per donor. But its earned income collapsed after losing Telangana to the Congress — a reminder that even vast reserves don't guarantee political survival.
Actual earned income in ₹ Crore. BRS lost Telangana to the Congress in late 2023.
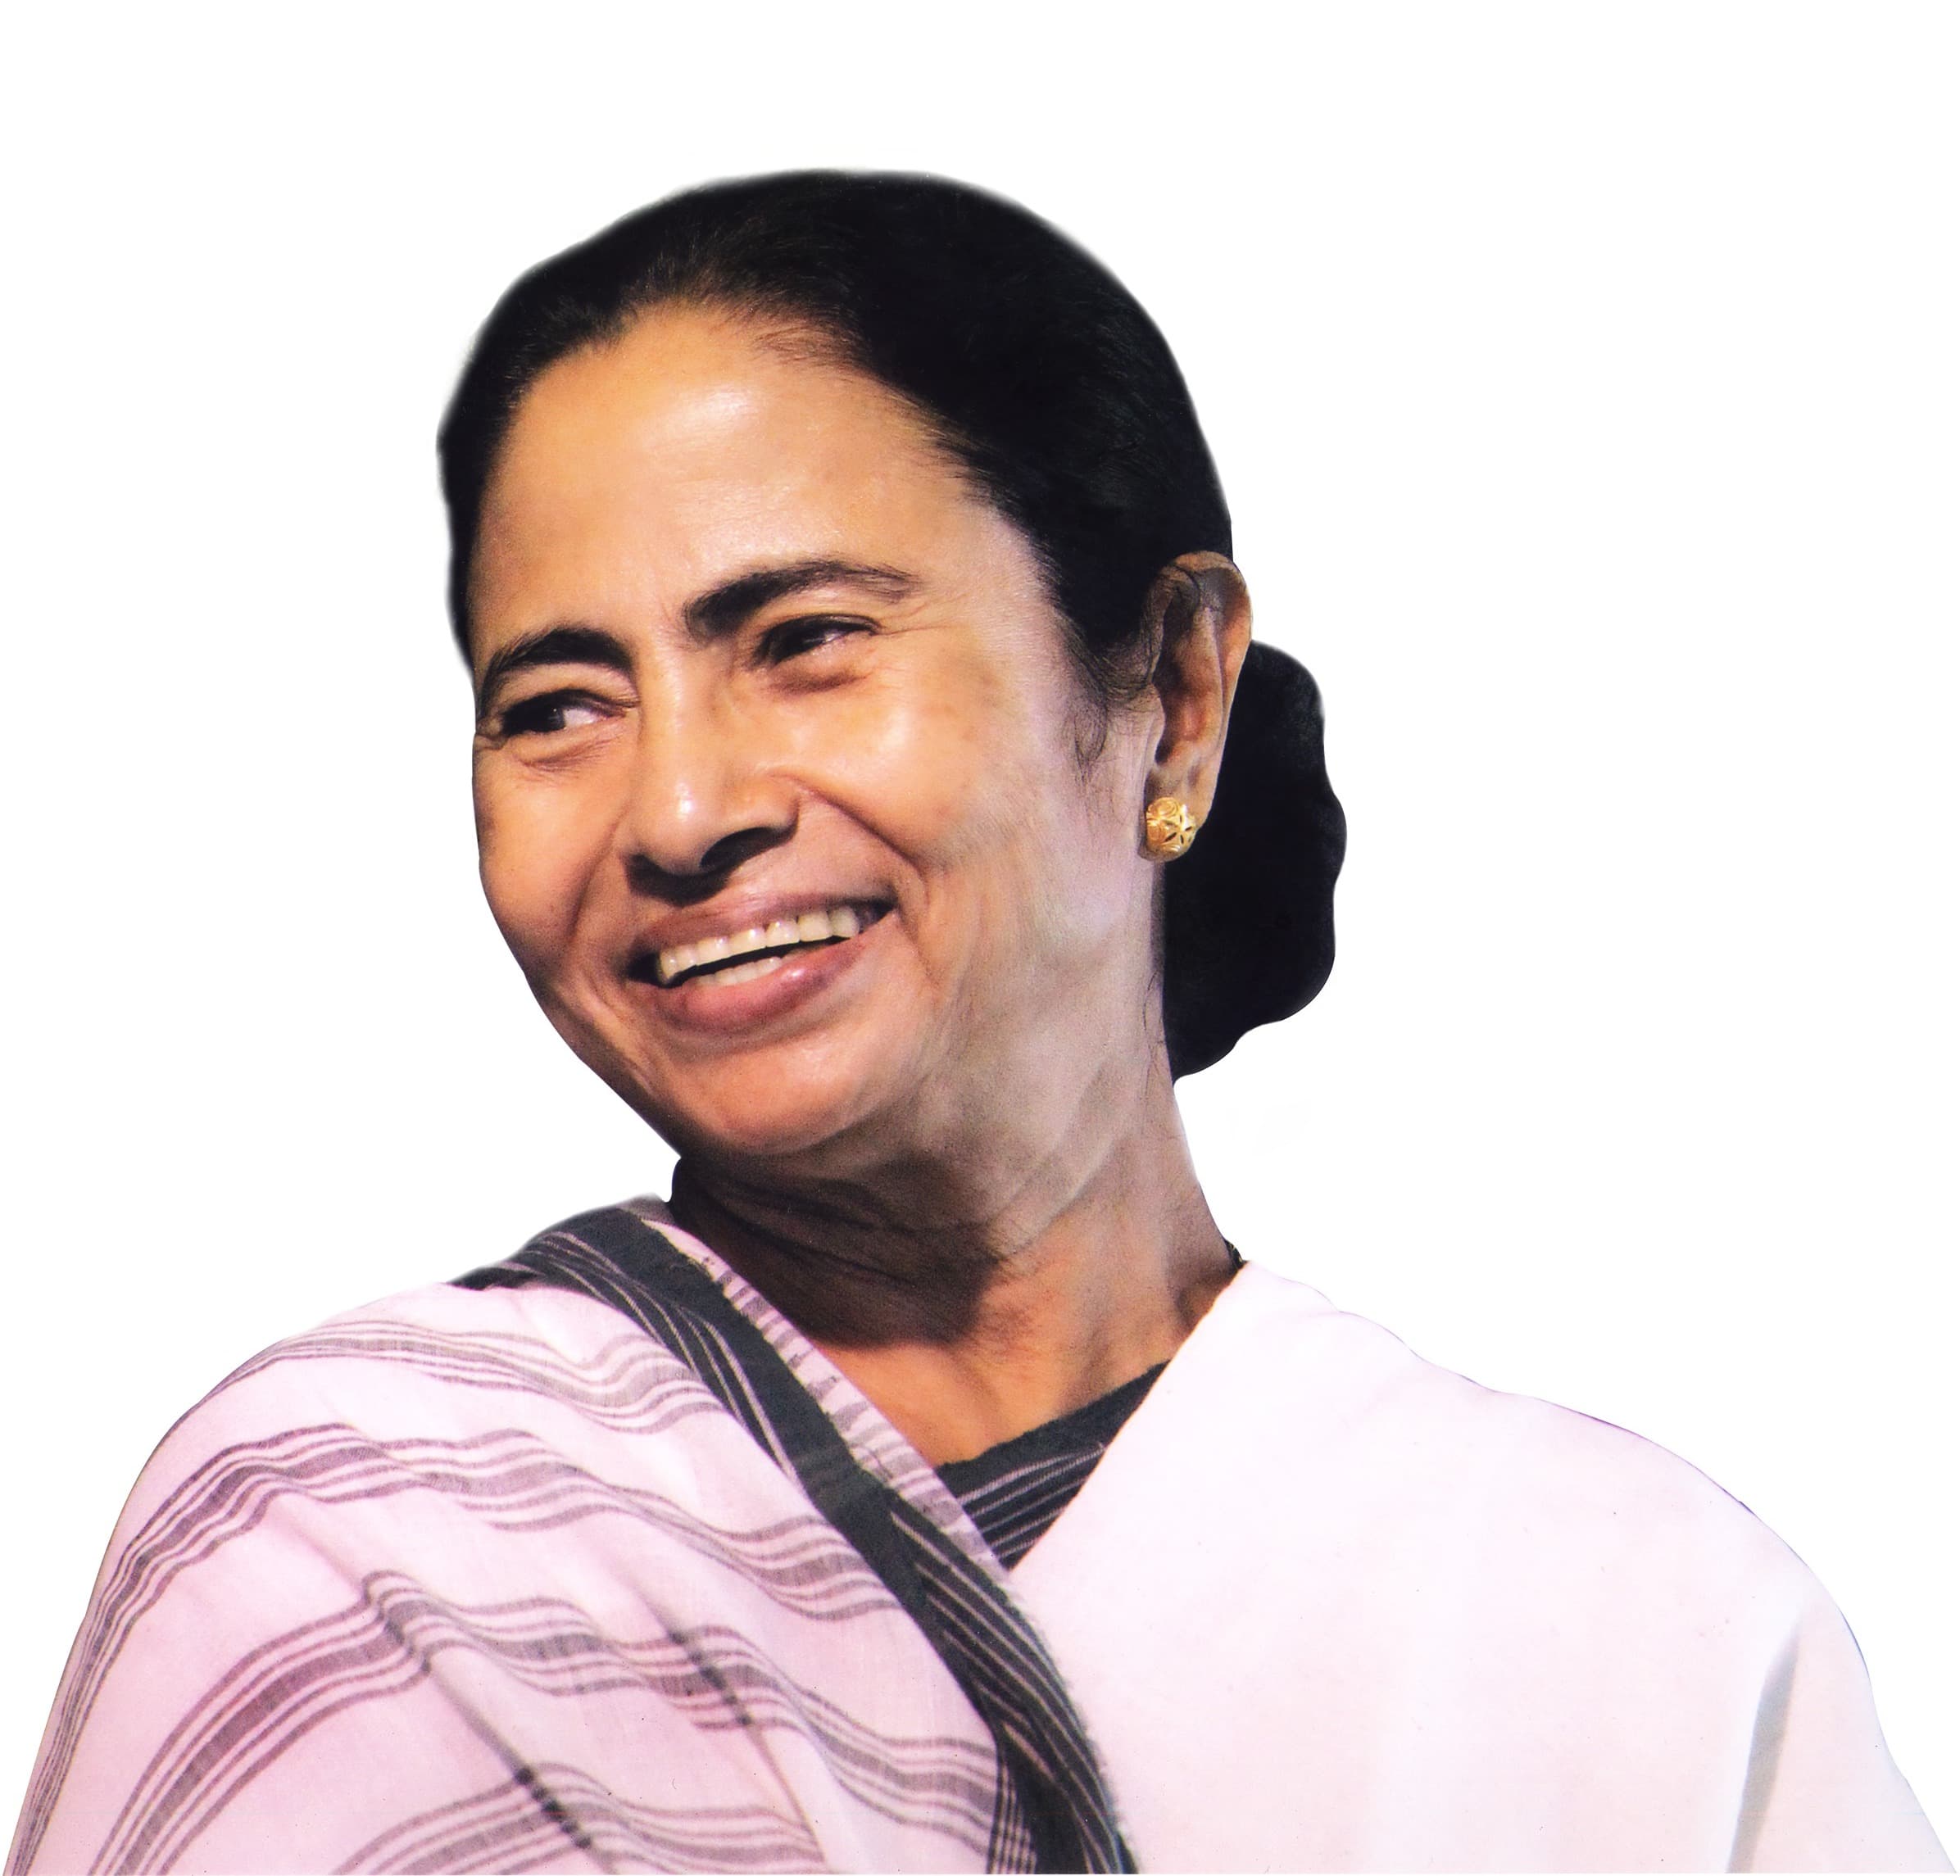
The TMC is the third-richest party in India (₹1,019 Cr) and the only major regional party with a serious investment portfolio (₹251 Cr). It earned ₹219 Cr in FY25, runs on remarkably lean fixed assets (₹7 Cr — largely rented offices), and per Supreme Court disclosures encashed ₹1,705 crore in electoral bonds — the third-highest of any party nationally.
Actual earned income by source, in ₹ Crore.
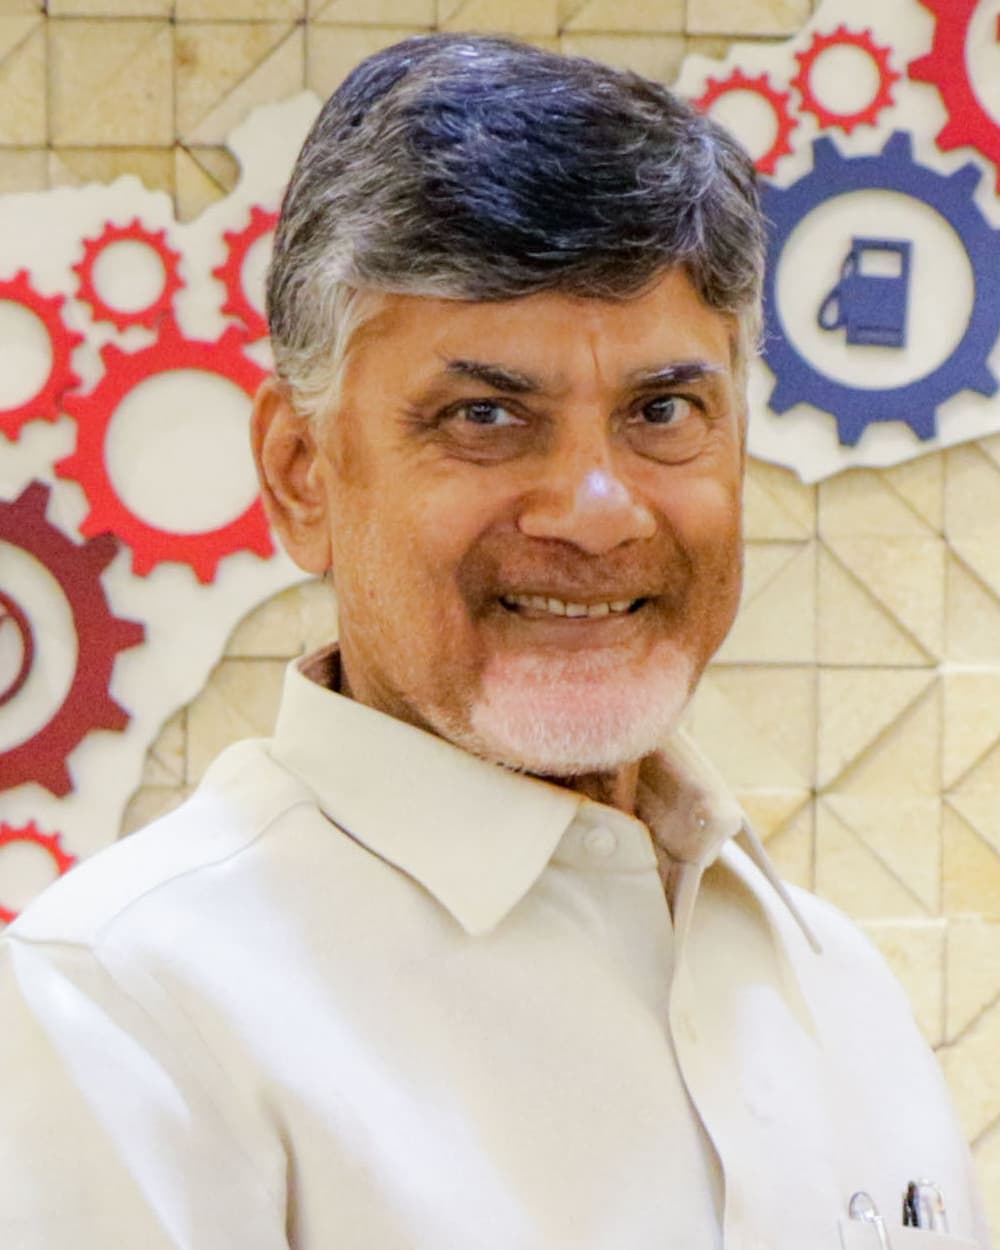
TDP runs a financial model unlike any other major party: membership fees alone bring ₹120 crore — 52.6% of its total income, the only party where members provide the majority of funds. It is also the most cash-heavy in the top 10, holding ₹366 crore in pure cash (76.8% of assets). Naidu's party won the 2024 Andhra Pradesh elections as part of the NDA.
Income by source, in ₹ Crore — members provide the majority.
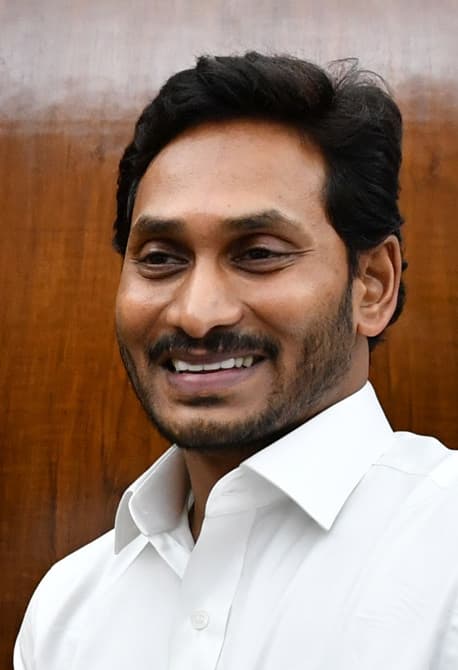
No party's finances tell a sharper story than YSRCP's. It was the #1 election-spending regional party in the 2024 Lok Sabha (₹328 Cr) and spent ₹300 crore on campaigns in FY25 alone — then lost both the Lok Sabha and Assembly elections in Andhra Pradesh. Its assets cratered from a ₹339 Cr peak to just ₹38 crore — an 88.7% collapse — while it ran a ₹199 crore deficit.
Total assets in ₹ Crore, FY 2021-22 to FY 2024-25.
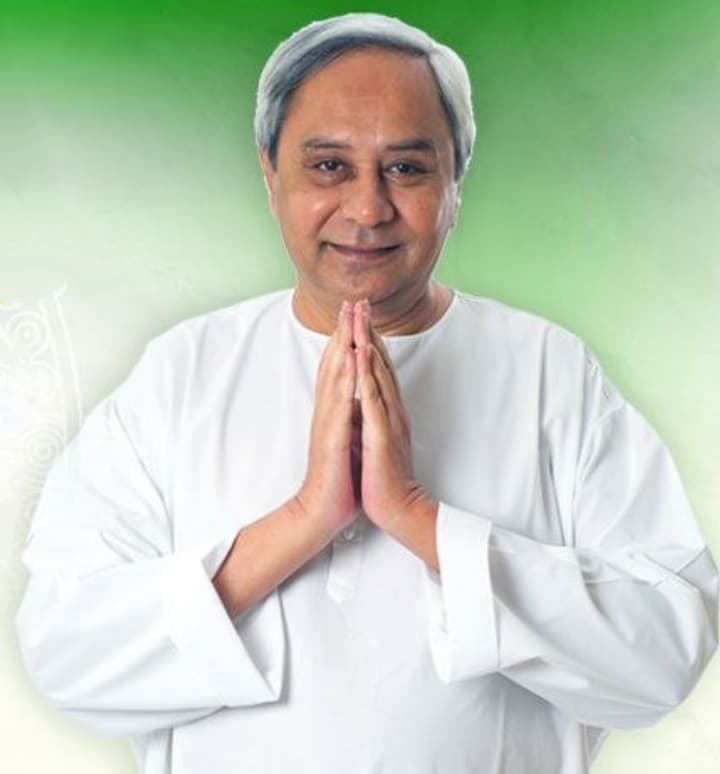
The sixth-richest party in India (₹720 Cr), BJD has arguably the cleanest balance sheet in the top 10 — near-zero debt and earmarked funds. Even after losing the 2024 Odisha elections to the BJP, it spent ₹271 Cr on elections and still added ₹178 crore to its general fund. Like BSP and BRS, it has declared zero donors since FY 2020-21.
Actual earned income by source, in ₹ Crore.
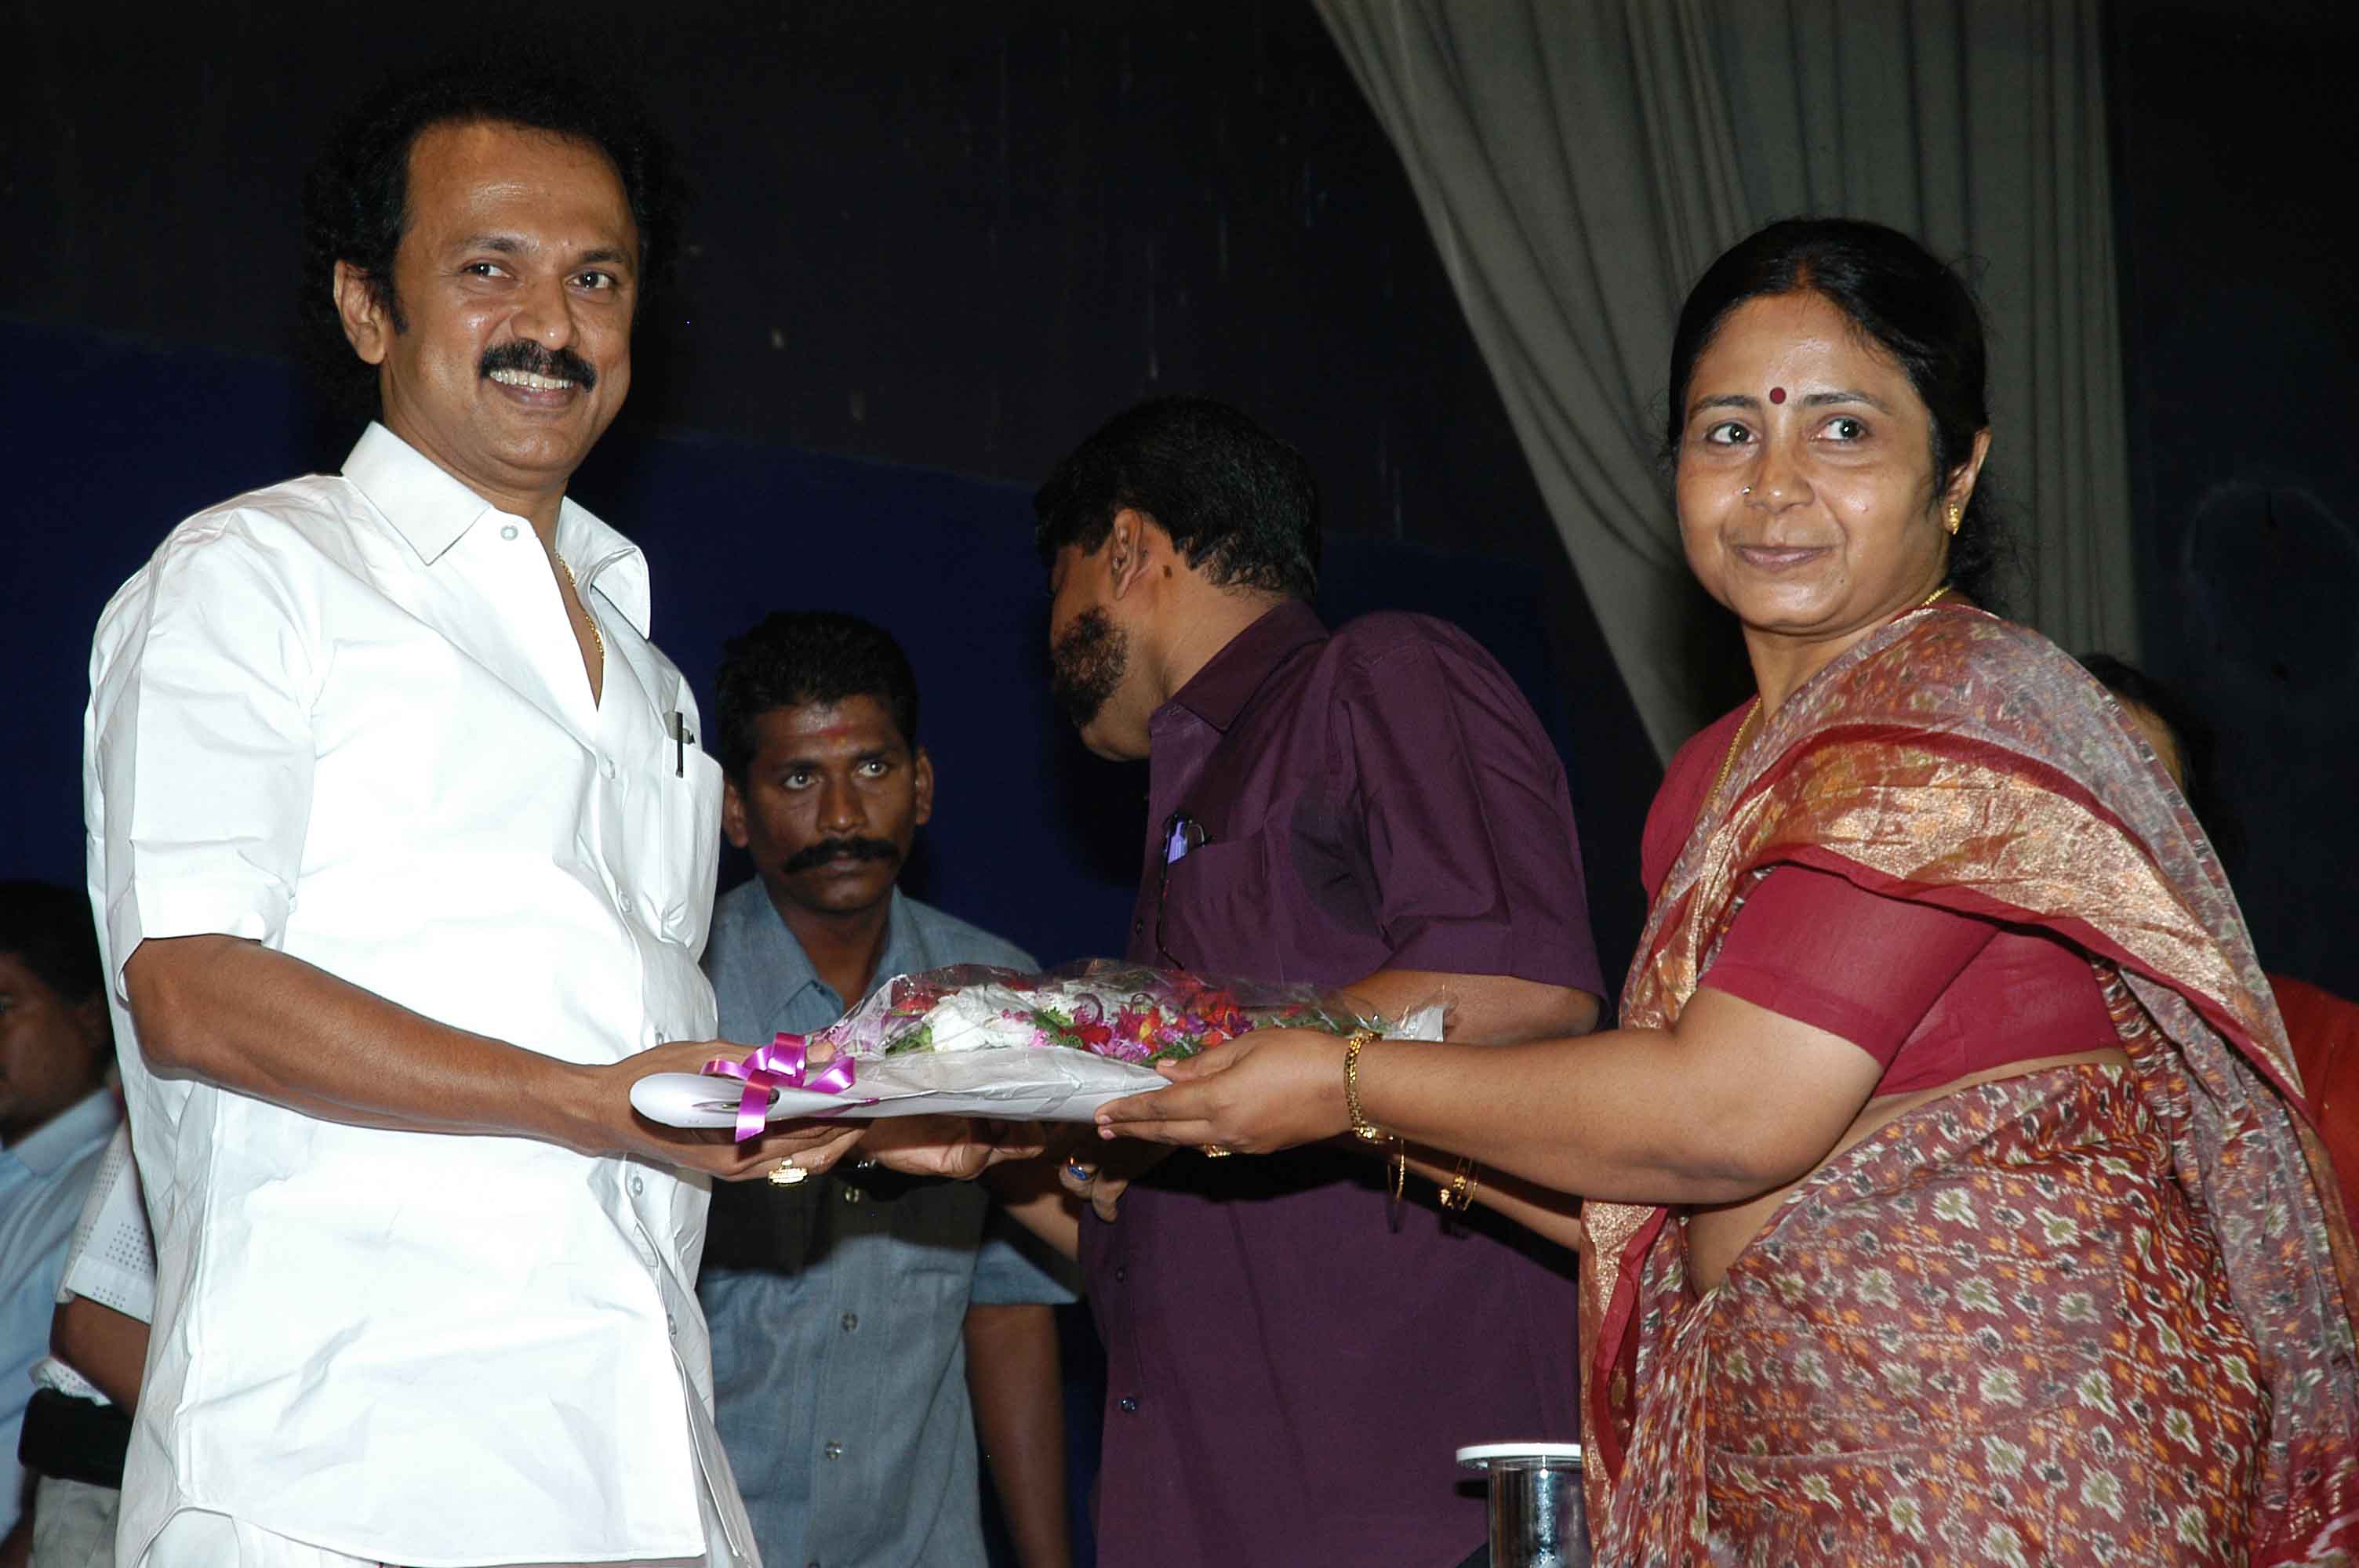
Tamil Nadu's richest party by a wide margin (₹554 Cr assets, FY 2023-24), DMK earned ₹181 Cr with meaningful grassroots support — ₹16.5 crore came from membership fees. It holds ₹515 Cr in highly liquid current assets and carries zero borrowings.
Actual earned income by source, in ₹ Crore.
Five more regional heavyweights round out the picture — each with a distinct financial signature:
Total assets in ₹ Crore.
The single clearest pattern across two decades of filings: the gap between the BJP and everyone else is not narrowing — it is widening. Average donations also reveal two completely different funding models. A handful of parties depend on a few enormous cheques; others run on lakhs of tiny ones.
In ₹ Lakh. BRS figure is FY 2022-23; others FY 2024-25. (1 Cr = 100 Lakh.)
| Party | Earned Income (Cr) | Expenditure (Cr) | Assets (Cr) | Surplus/Deficit (Cr) | Donors |
|---|---|---|---|---|---|
| BJP | 6,769.15 | 6,769.15 | 12,171.18 | +2,994.57 | 5,522 |
| INC | 918.29 | 1,111.95 | 839.09 | -193.66 | 2,501 |
| CPI(M) | 172.60 | 173.86 | 782.52 | -1.26 | 741 |
| BSP | 58.59 | 106.31 | 666.30 | +47.72 | 0 |
| AAP | 39.28 | 39.28 | 11.01 | +2.82 | 2,554 |
| NPP | 2.19 | 2.19 | 4.15 | +0.99 | 25 |
| Party | FY | Earned Income (Cr) | ITR Total (Cr) | Assets (Cr) | Surplus/Deficit (Cr) |
|---|---|---|---|---|---|
| BRS | 2024-25 | 123.68 | 180.60 | 1,560.81 | +56.92 |
| AITC | 2024-25 | 219.35 | 227.60 | 1,018.79 | +8.24 |
| BJD | 2024-25 | 110.14 | 288.44 | 720.57 | +178.30 |
| DMK | 2023-24 | 180.95 | 200.07 | 553.85 | +19.12 |
| SP | 2024-25 | 20.33 | 74.74 | 503.36 | +54.41 |
| TDP | 2024-25 | 228.32 | 228.32 | 476.66 | +166.98 |
| AIADMK | 2024-25 | 86.24 | 86.24 | 327.16 | +35.86 |
| YSRCP | 2024-25 | 140.39 | 340.20 | 38.47 | -198.82 |
| JD(U) | 2024-25 | 27.94 | 38.70 | 162.55 | +10.75 |
| JSP | 2024-25 | 64.11 | 64.11 | 142.06 | +7.16 |
| MNS | 2024-25 | 60.78 | 60.78 | 83.36 | +36.27 |
India's party-finance landscape is defined by one dominant player and a long tail. The BJP holds more assets than the next twenty parties combined and accounts for 85% of all national-party income. Beneath it sits a surprising tier of cash-rich regional players — BRS, TMC, BJD — several richer than the Congress. And running through every filing is the same lesson the 2024 elections drove home: money buys campaigns, but it does not buy victories. YSRCP outspent everyone and lost everything.
All figures are drawn from Election Commission of India annual audit reports and income-tax returns, as published by the Association for Democratic Reforms (ADR) and MyNeta, and cross-checked line by line. Where party formats include a surplus/deficit balancing line, we report the actual earned income separately. CPI(M) leadership details were verified against public reporting from April 2025; YSRCP and electoral-bond figures against ADR's 2024 Lok Sabha analysis and Supreme Court disclosures.
Association for Democratic Reforms (ADR) MyNeta — National Election Watch Election Commission of IndiaPoliticsGod's Own Country at the Crossroads. Inside the battle that aims to either break the state's historical political loop—or reinforce it permanently.
Breaking: India invokes Section 69A of the IT Act to block Telegram until June 22 and disable message editing till June 30 — ahead of the 22.8-lakh-student NEET UG retest on June 21. Full investigation: the paper leak, the fraudsters, the CBI arrests, the Cockroach Janta Party protests, and a historic first — the Indian Air Force deployed to deliver exam papers.
 Politics
Everything you need to know about the most unpredictable Tamil Nadu election in a generation — History, Alliances, Manifestos, and Demographics.
If this research helped you understand an important issue, consider supporting independent investigative journalism.
Support StoryRendered